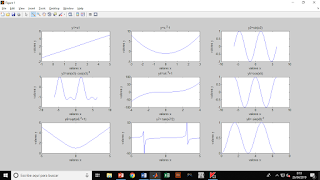
clc;
clear all;
%GRAFICA FUNCION y1=x1
x1=-1:5;
y1=x1;
subplot(3,3,1);
plot(x1,y1)
xlabel('valores x');
ylabel('valores y');
title('y1=x1');
%GRAFICA FUNCION y=x.^2-1
x=-3:0.1:3;
y=x.^2-1;
subplot(3,3,2);
plot(x,y);
xlabel('valores x');
ylabel('valores y');
title('y=x.^2-1');
%GRAFICA FUNCION y2=sin(x2)
x2=linspace(-2*pi,2*pi,70);
y2= sin(x2);
subplot(3,3,3);
plot(x2,y2);
xlabel('valores x');
ylabel('valores y');
title('y2=sin(x2)');
%GRAFICA FUNCION y3=sin(x3)- cos(x3).^2
x3=linspace(-2*pi,2*pi,70);
y3= sin(x3)- cos(x3).^2;
subplot(3,3,4);
plot(x3,y3);
xlabel('valores x');
ylabel('valores y');
title('y3=sin(x3)- cos(x3).^2');
%GRAFICA FUNCION y4=x4.^3+1
x4=linspace (-4,4,100);
y4= x4.^3+1;
subplot(3,3,5);
plot(x4,y4);
xlabel('valores x');
ylabel('valores y');
title('y4=x4.^3+1');
%GRAFICA FUNCION y5=cos(x5)
x5=linspace(-2*pi,2*pi,100)
y5= cos(x5)
subplot(3,3,6);
plot(x5,y5);
xlabel('valores x');
ylabel('valores y');
title('y5=cos(x5)');
%GRAFICA FUNCION y6=sqrt(x6.^2+1)
x6=linspace(-5,5,100);
y6= sqrt(x6.^2+1);
subplot(3,3,7);
plot(x6,y6);
xlabel('valores x');
ylabel('valores y');
title('y6=sqrt(x6.^2+1)');
%GRAFICA FUNCION y7= tan(x7/2)
x7=linspace(-2*pi,2*pi,100);
y7= tan(x7/2);
subplot(3,3,8);
plot(x7,y7);
xlabel('valores x');
ylabel('valores y');
title('y7= tan(x7/2)');
%GRAFICA FUNCION y8= sin(x8).^2
x8=linspace(0,2*pi,100);
y8= sin(x8).^2;
subplot(3,3,9);
plot(x8,y8);
xlabel('valores x');
ylabel('valores y');
title('y8= sin(x8).^2');

No hay comentarios:
Publicar un comentario